Page 1 of 1
Graph paper script
Posted: Thu 19 Dec 2013, 01:02
by don570
Here is a script that will create professional looking graph paper.
Edit:
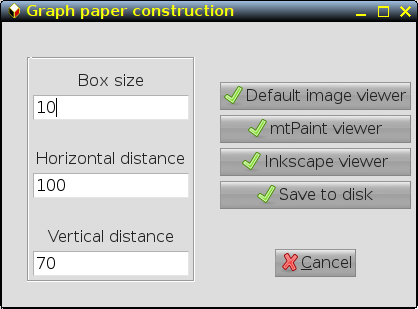
To explain the GUI --->
Box Size  10
Horizontal  Distance   100
Vertical distance   70
makes a document 1000 horizontal dots by 700vertical dots.
You must convert this to inches or the metric system when using a printer.
Edit: I switched to a pet package for convenience.
It is gettexted for anyone interested in translating.
Start Menu > Documents
Contributed by Vovchik, Seaside and Don White
The script runs in the usual way
./Graphpaper.sh
Follow the instructions and save your graph paper to disk as an SVG file.
Default name is <default>/root/Graphpaper.svg</default>
but that is easy to change by clicking file icon.
Posted: Thu 19 Dec 2013, 21:50
by don570
version 1.0 - pet package
I switched to a pet package for convenience. It is gettexted
for anyone interested in translating.
Start Menu > Documents
____________________________________
Posted: Fri 27 Dec 2013, 10:54
by vicmz
Nice

Note: the 'save to disk' button isn't gettexted, I've done it myself before translating.
Posted: Fri 27 Dec 2013, 22:00
by don570
Thanks for looking at the script. I'll post a finished pet package.
I should try a French and German translation.
__________________________________________
New version 1.1
Posted: Sat 28 Dec 2013, 17:43
by don570
New version 1.1
I corrected a dumb mistake that prevented the SVG image from forming
if the 'Save to disk' button was clicked. I didn't realise that functions are
tricky to put in <action> directives if they have an ampersand &.
The function didn't work the way I thought it would and the exiting of the
GUI wasn't occuring when I thought it would occur.
___________________________________________________
Thanks to vicmz there is a Spanish tranlation. I was inspired to
try my hand at translating with the help of Google translate.
I attempted Russian, Portuguese ,French and German.
They are all inside the pet package. I have posted the script if
anyone is interested in translating with momanager.
Remember that momanager requires the devx file to be installed.
____________________________________________________
Posted: Fri 27 Sep 2019, 05:05
by icosahedron
Hi,
Can someone help me to use this application, please?
I'm neither an artist nor a mathematician, so I'm not familiar with the jargon and I can't figure out the formulas.
The Graphpaper application has 5 parameters:
Box Size, Horizontal Distance, Vertical Distance, Width, and Height.
After over an hour of trial-and-error, I've figured that Width and Height are the overall size of the graphpaper in pixels, and that Width needs to be a whole multiple of Horizontal, and Height needs to be a whole multiple of Vertical, but I don't really know what Horizontal and Vertical refer to.
They seem to alter the number of grid squares across the paper, but I'm not sure exactly how, and the Box Size parameter is a complete mystery. It seems to affect the visibility of the lines, and a value of 5 seems to be nor too obtrusive when zoomed out, yet still visible when zoomed to 800x for pixel work, but I can't see what the numbers refer to, or what is actually changing.
Can someone also tell me what the pixel size is on MT Paint? I want to create graph paper with squares of 0.2 / 1.0 cm on an A4 sheet, but I can't figure out what numbers to enter into the parameter boxes to obtain this output.
Thanks.
Posted: Sat 28 Sep 2019, 19:41
by don570
I've never printed in mtpaint. Apparently it uses pixels so a conversion is needed.
This website seems to do the conversion.
https://www.papersizes.org/a-sizes-in-pixels.htm
____________________________________________________
There are three numbers fill out,
but I've noticed that the script becomes confusing if the standard numbers aren't used. (see image)
The numbers to fill in fields are pixels.
__________________________________________
Posted: Sun 29 Sep 2019, 23:00
by wjaguar
icosahedron wrote:I want to create graph paper with squares of 0.2 / 1.0 cm on an A4 sheet, but I can't figure out what numbers to enter into the parameter boxes to obtain this output.
The attached Postscript file should produce the paper you want. Just unpack it (
gunzip) and send it to printer:
lpr graph.ps
If you want to change the parameters (margins, squares size, paper size) the file can be modified in a text editor.
Posted: Tue 01 Oct 2019, 23:05
by don570
I checked the old script on fatdog linux and it works properly
except the inkscape button launches a totally black document??
Perhaps it needs inkscape lite.
To explain the GUI --->
Code: Select all
Box Size 10
Horizontal Distance 100
Vertical distance 70
makes a document 1000 horizontal dots by 700 vertical dots.
You must convert this to inches or the metric system when using a printer.
_______________________________________________________
wjaguar wrote:The attached Postscript file should produce the paper you want. Just unpack it (gunzip) and send it to printer: lpr graph.ps
I"ll check using fatdog linux.
______________________________________
Posted: Wed 02 Oct 2019, 23:22
by don570
When I opened up the ps format file that wjaguar provided using
a recent windows gimp app I found that there is a fault in the graph paper.
Namely a column isn't wide enough. (see image)
The right column is slightly narrower than left column.
Posted: Wed 02 Oct 2019, 23:35
by rcrsn51
How about this?
Posted: Thu 03 Oct 2019, 00:00
by don570
I used windows 10 GIMP program to open file.
There must be a bug in windows postscript???
Posted: Thu 03 Oct 2019, 03:28
by wjaguar
don570 wrote:Namely a column isn't wide enough. (see image)
The right column is slightly narrower than left column.
Some rows & columns will inevitably differ by one pixel from the rest. For the simple reason that DPI means dots per
inch. No real-life DPI value gives you a whole number of pixels per
millimeter (printer DPI usually is some multiple of 300).
Posted: Sat 05 Oct 2019, 16:18
by don570
I checked graph.ps.gz in fatdog linux...
ps2pdf is builtin to fatdog linux and I was able to open the file as graphpaper
in 2 programs ---> gimp and document viewer 2.32
gimp had the same problem as I saw in the window 10 GIMP.
Document viewer 2.32 had the strange problem of two thick black lines
(see image)
Posted: Sun 06 Oct 2019, 11:46
by wjaguar
don570 wrote:gimp had the same problem as I saw in the window 10 GIMP.
Which is inevitable, as explained above. Pixel grid is not metric.
don570 wrote:Document viewer 2.32 had the strange problem of two thick black lines (see image)
The thicker lines should be there every centimeter (i.e. after every 4 thinner ones). But, with DPI of mere 96, "Document viewer" was trying to compensate for linewidths it could not reproduce with any precision, by antialiasing the lines, and bungled the job badly (behold the consequences of not knowing what "gamma correction" is).
Posted: Sun 06 Oct 2019, 13:49
by Moose On The Loose
wjaguar wrote:don570 wrote:gimp had the same problem as I saw in the window 10 GIMP.
Which is inevitable, as explained above. Pixel grid is not metric.
On the gimp I use, the import allows you to change the resolution to 254 which seems to comes out even.
I, however, am not using one that comes with legacy software from Washington State. Perhaps others may want to try this on a good OS like perhaps Puppy Linux.
The copy of "gv" on Puppy 528 produces a blank page. That looks like a different issue.
Posted: Wed 09 Oct 2019, 19:54
by wjaguar
Moose On The Loose wrote:On the gimp I use, the import allows you to change the resolution to 254 which seems to comes out even.
As it should in that case.

Still, real physical devices with DPI like that, or any multiple of that, are really rare.
The copy of "gv" on Puppy 528 produces a blank page. That looks like a different issue.
No such problem here on Slackware 14.2 (gv 3.7.4, GPL Ghostscript 9.26).