

In this tutorial graph paper is created ---> 10 points by 10 points
1) Select RGB or indexed color document ---> any size
2) View > Show dock should be chosen
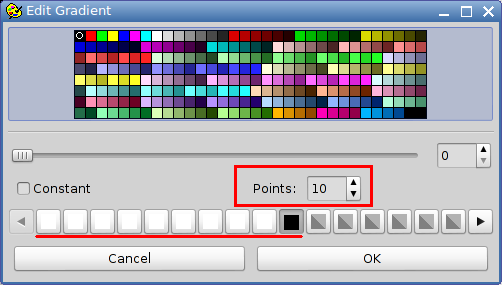
3) Right click on Place Gradient to create a custom gradient.
Click 'Edit Custom'.
There should be 10 points. 9 white and the last one black.
Click OK to close 'Custom' window.See image...
4) Choose 'Linear' and 'Repeat' ---> a repeat length of 9 rather than 10
gives better results. See image....
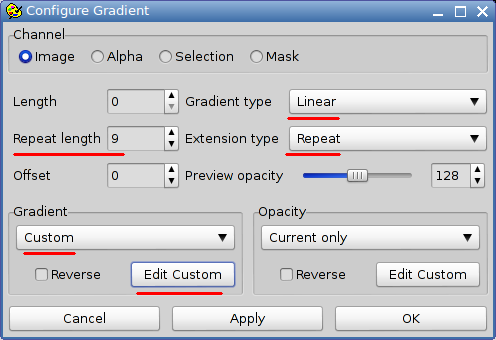
5) Click Apply and OK
6) Click in settings dock for gradient mode to be active
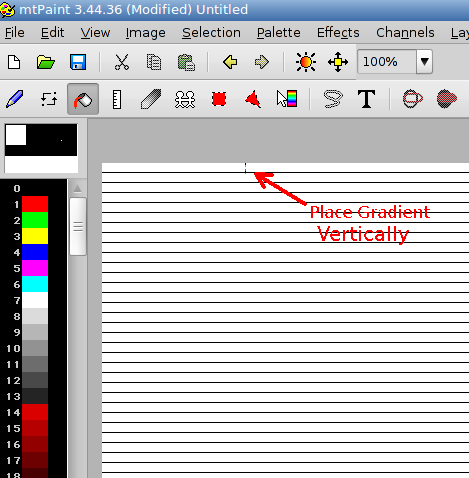
7) Click 'Place gradient' icon and place the gradient. Be careful to observe
numbers at bottom of window to make the gradient vertical and a length of 10 points.
Tip: Hold down Shift or CTRL-shift keys to achieve 90 degree angles
8 ) Colors
A ----> white
B ----> black
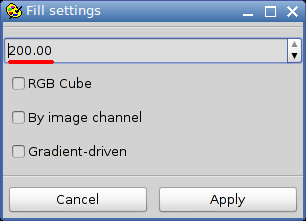
9) Right click on Flood fill icon. Set the Flood fill ----> to highest number .
'Gradient driven' can be set on or off.
10) Click in document with Flood fill. See results.
11) Make a new upper layer
Transparent color 7
Show all layers
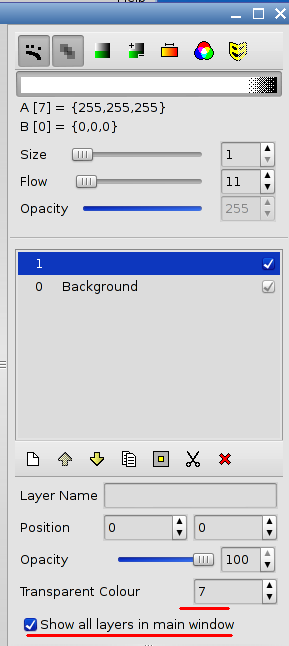
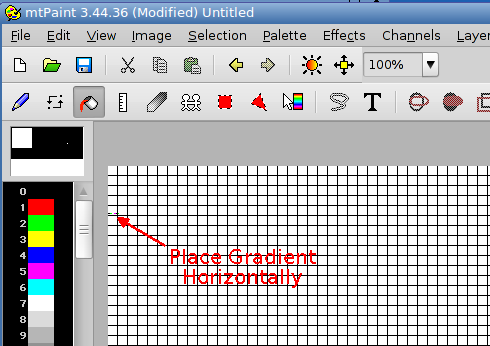
12) In the upper layer, click on the Place Gradient.
place horizontally a distance of 10 points for the vertical lines
13) Make sure Gradient mode is active and do a flood fill
14) Save the result to your hard disk by
Layers > Save Composite image
Transparency set to -1
_______________________________________________

